

For many years, organizations have been looking for the secret ingredient that’ll drive business value, ROI, and additional metrics for success. But what if we told you it was right in front of you?
The secret ingredient is an intuitive OneView Analytics Dashboard.
What is the importance of analytics?
Imagine if you could get real-time insights on every aspect of the customer journey, from marketing to post-sales processes. All of that data, right at your fingertips; It could allow you to make informed decisions without the guesswork.
Meaningful data helps you build omnichannel Customer experiences that are positive, compelling, and effective, helping your customers feel heard and understood. Data can also give you deep insights into every customer interaction and outcome.
So imagine how much your business would change if you had access to all of that data?
Nowadays, gathering data is not as difficult as you think. The biggest challenge is understanding this data. A OneView Analytics Dashboard gives you a clear and accurate view of information in real-time, and allows you analyze the overall situation. It gives you the information you need to make effective decisions.
A walkthrough of the OneView Analytics Dashboard
Engati’s OneView Dashboard is packed with insights and analytics. With interactive pie-charts, Engati makes it easy to visualize and understand your data.
To access the dashboard, all you have to do is log in to Engati, and click on Analytics. You’ll be greeted with two options.
- Chatbots
- Live Chat
Let’s walk you through chatbots first.
TIP: Do keep in mind that access to analytics is limited to users with Owner, Administrator or Executive roles.
Chatbots
The Chatbot Analytics Dashboard provides the bot admins with a quick overview of how the bot is performing across the various platforms configured. The fundamental unit we use is called 'interactions', which is single too and fro communication between the bot and user.
Once your chatbot is deployed and catering to your users, stats and insights become really important to understand how your chatbot is performing and what could be tweaked to improve its responsiveness. The various dashboards provided are around overall engagement and trends, dashboard focused around the automated responses, retention patterns for the chatbot and support agent dashboard.
1. Engagement
Customer engagement is an important aspect of a business since it drives all three aspects of a marketing use case Lead generation, Customer Acquisition and retention. Advanced NLP enabled conversational bots to drive targeted and interactive engagement options. Engati enables the bot builders to track the quantity and quality of engagement on their bots.
Engagement Dashboard provides analytics on various aspects showcasing your users’ engagement with the bot. Key metrics highlighted include Interaction Metrics, New vs Active Users trending and occurrences/usage of certain messages or actions within the Bot User Journeys.
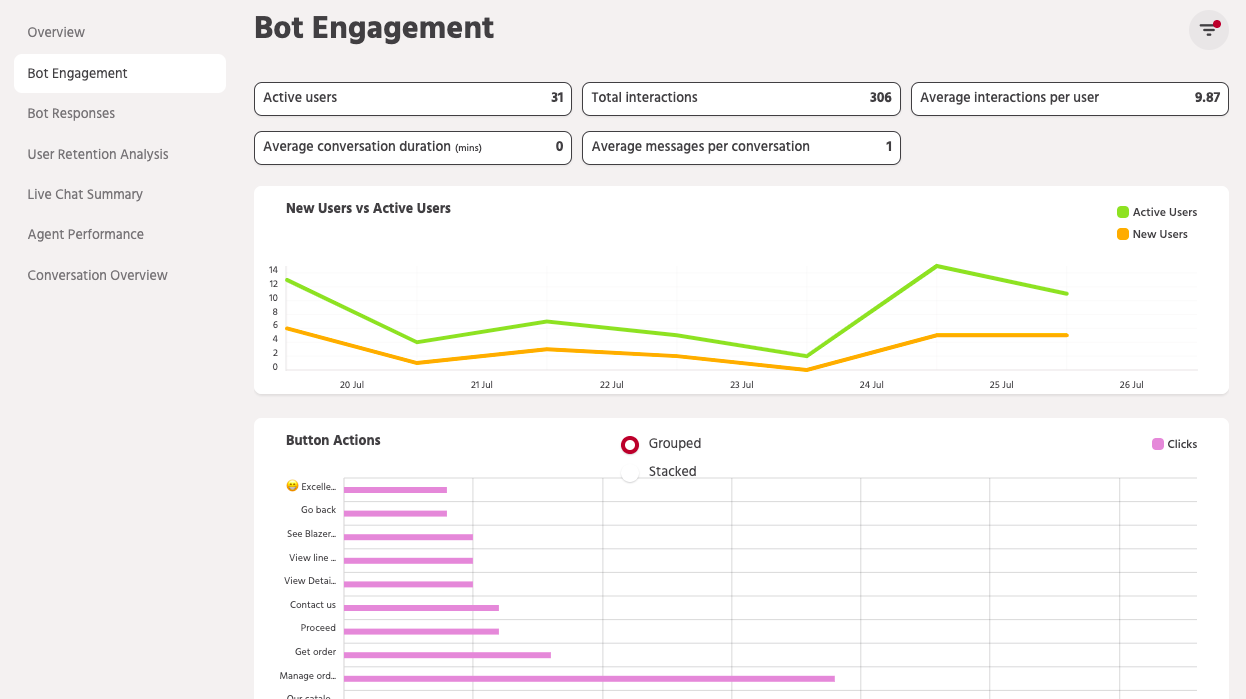
Measuring engagement
This module showcases the key metrics relevant to tracking user engagement with the bot.
Any input from a user be it a text for a query or selection of an option by clicking a button is counted as an interaction with the bot. See below for a quick description of each of these included metrics.
- Total Interactions
This number represents a cumulative sum of all the interactions that have taken place in the time duration selected in the date filter - Average Interaction per user
This shows the average number of interactions a bot has with each user. A higher number in average interactions indicates quality engagement between a user and the bot. - Average conversation duration
To get to this number we calculate the time spent by a user on the bot and then take an average for all the users. - Average messages per conversation
This shows the number of messages received by a bot averaged over all the users.
Dashboard Charts
There are three key charts available on the page as described below. Also, please note that the aggregated charts data available on this dashboard is available only for date ranges older than a day (i.e. Today).
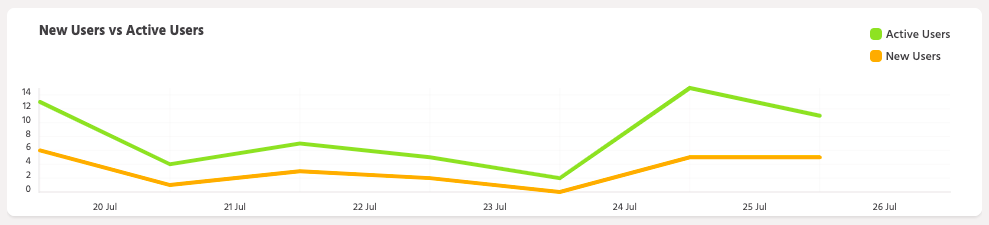
New users versus Active users
This graph shows the date-wise distribution of new users vs active users on the bot. A higher number of new users show a higher reach of the bot and maintained a number of active users represent retention.
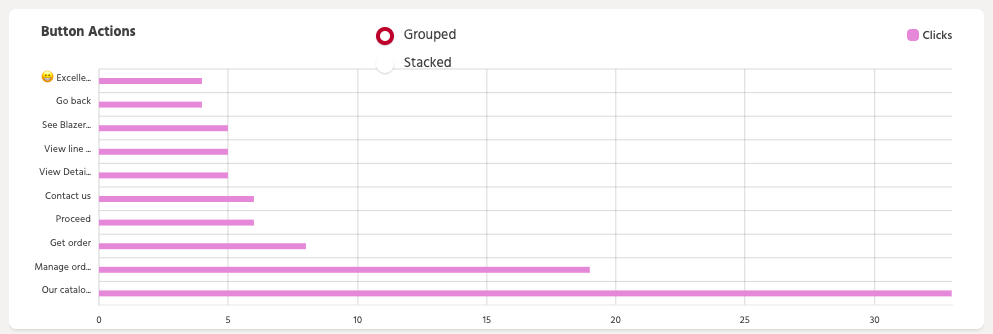
Button Actions
This table displays the data when you have used buttons while creating your bot. The data will reveal the user’s actions on the button during their bot conversations. The green bar shows the number of clicks for that specific button. This chart is particularly useful for doing a clickthrough or conversion analysis based on the user journeys within the Bot.
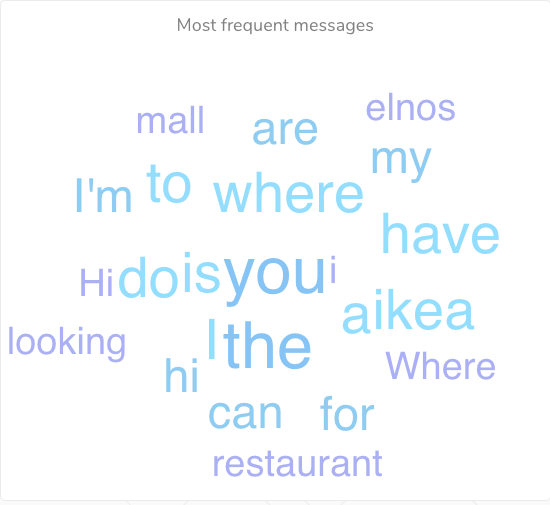
Most frequent messages
Most frequently used words/queries are displayed in this section. This helps you understand the frequently asked questions in a quick glance and focus on improving the training for the bot around those keywords or queries.
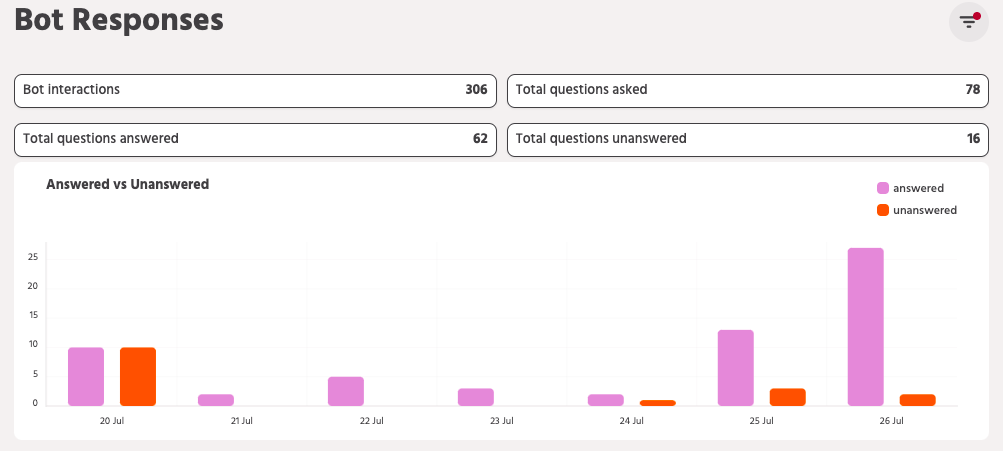
2. Responses
The Responses Dashboard can be found in the navigation under the Analytics -> Bots section. It is available to all users irrespective of the allocated plan.
Response metrics
This module showcases the key metrics relevant to tracking chatbot efficiency.
Any input from a user be it a text for a query or selection of an option by clicking a button is counted as an interaction with the bot. See below for a quick description of Interactions & other included small business metrics.
- Total Interactions
This number represents a cumulative sum of all the interactions that have taken place in the time duration selected in the date filter - Total questions asked
This is the total number of questions asked on the bot by all the users in the given span of time. - Total questions answered
This provides information on the total questions answered by the bot. - Total questions unanswered
This provides information on the questions for which a default response was triggered. This typically happens when the Chatbot was not able to find the most suitable response for the user’s query. Accordingly, these are counted as unanswered and having this information helps a user to work on training the bot and adding more FAQs to reduce the number of unanswered questions.
To help narrow down to unanswered queries easily, the metrics for unanswered and answered queries are clickable and redirect you to the Train Workflow with the appropriate interactions filtered based on what you had clicked on.
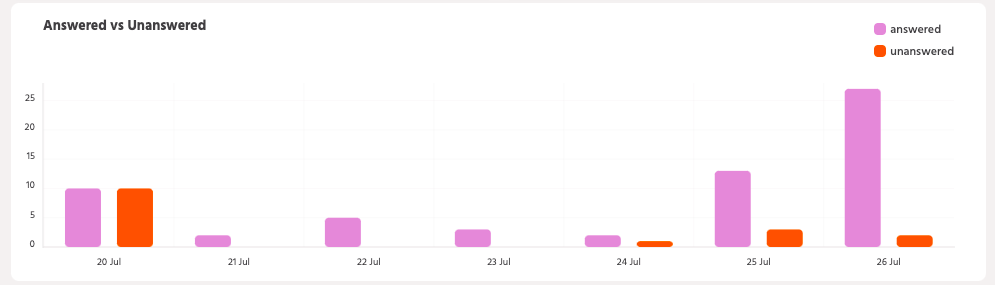
Answered vs Unanswered Trend
Besides providing aggregated information for a given timeline, Engati also provides a running trend of answered vs. unanswered queries. Use this graph to watch out for any increasing trend around unanswered queries.
And if that is the case, then you may want to revisit the unanswered queries and train the bot to better handle these scenarios.
3. Retain
To aid you with making fast deductions about the user trend, the data is presented in an easy to decipher table that groups together users engaging with the chatbot on any particular day.
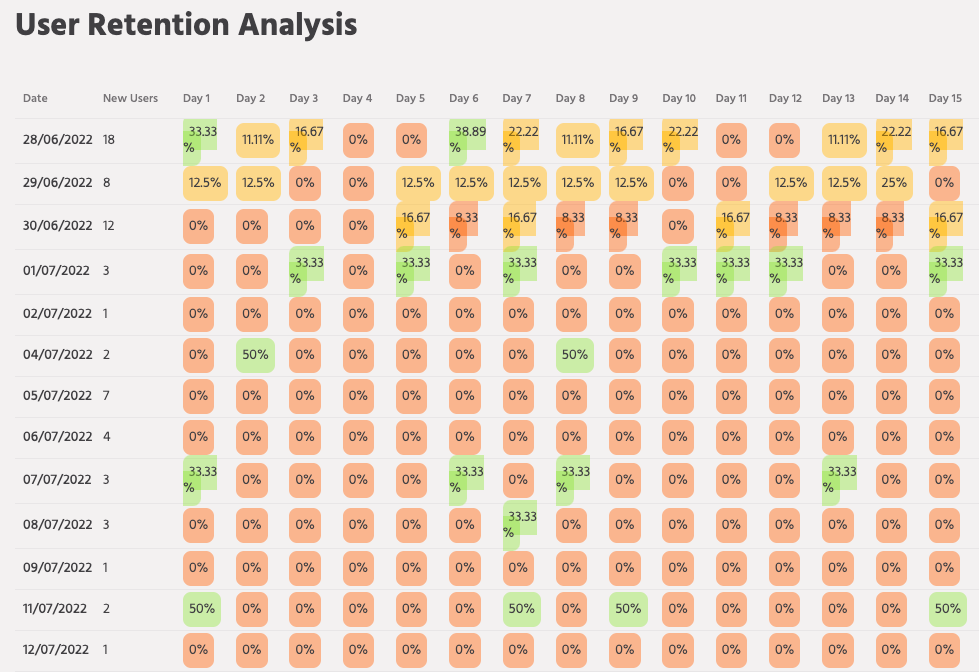
- The First Column represents the dates from the last 30 days starting with the most recent at the very bottom.
- The Second Column highlights the number of new users that had engaged with the bot for the first time on that particular date
- The subsequent columns then all represent the %age of users from that date that returned to engage with the bot, X days later
For an illustration of the above points, see the image below. In this example, 1753 users had engaged with the bot on 03rd October 2019.
Out of those 1753 users, 0.17% of them returned to engage with the chatbot again a day later. Continuing with the same, 0.11% of these 1753, again returned to engage with the chatbot 2 days later.
The deepness of the blue shade will represent a higher %age of returning users for that particular day vis-a-vis the set of new users who had joined the chatbot first on the date represented at the start of that row.

Live Chat
After setting up the product and releasing it to solve user queries, the analytics and the statistics can help you understand how the bot and the agents are attending to the user queries. The dashboards include metrics like response time, resolution time, number of requests coming, etc.
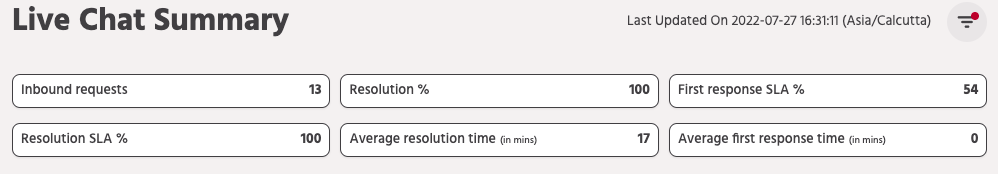
1. Summary view
In this section, the agent/supervisor will be able to see analytics for all conversations. i.e with agents and with the bot. Key metrics visible for this section would be Inbound Requests, Resolution, First Response SLA %, Resolution SLA%, Average Resolution time (in mins), Average First Response time (in mins)
Metrics
This section shows the key metrics for tracking user engagement with the bot and the agent.
- Inbound Requests: Number of inbound requests (new requests – both new conversations + re-opened conversations handled by both bot and agent) for the chosen time range
- Resolution %: Percentage of conversations resolved of the Inbound requests
- First Response SLA %: Percentage of conversations with first response within first response SLA as defined in Configure
- Resolution SLA %: Percentage of conversations with resolution within resolution SLA as defined in Configure
- Average resolution time (in mins): Average resolution time for incoming requests
- Average first response time (in mins): Average first response time for incoming requests
Graphs and Charts
Incoming Requests vs Resolved Chats.
In this section you’ll be able to see bar graphs showcasing incoming requests vs resolved requests. The agent/supervisor can choose Grouped or Stack view and the data shown would be according to the date filter set.

Pie Charts
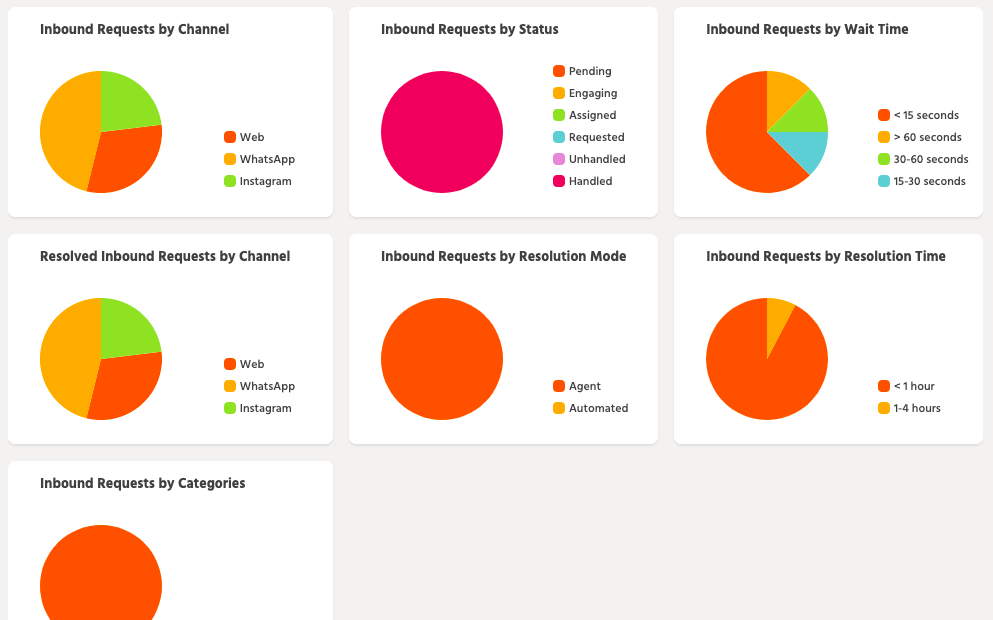
The pie charts are based on the below metrics:
Conversations by Channel: Inbound requests categorised by channels active for the product.
Resolved conversations by channel : Inbound Requests which have been resolved based on the user interaction channel
Conversations by Status: Inbound requests categorised by the status i.e pending resolution, active, resolved, etc.
Conversations by Resolution time: Inbound requests which were resolved before 1 hour, 1-4 hours, 4-12 hours, 12-24 hours, 1-7 days, more than 7 days.
Conversations by Resolution Mode: Inbound Requests resolved either by the agents or the bot.
Conversations by wait time: Waiting time for Inbound requests before attended by an agent.
Filter
The data on this dashboard can be filtered based on the date range selected in the date filter provided at the top of the dashboard.
2. Agents View
Agent Dashboard provides analytics to help you understand and track the efficiency of agents in answering users’ queries.
Metrics
The key metrics for each agent are: Inbound Requests, Resolved Requests, User Feedback, First Response SLA %, Resolution SLA %, Average first response time (in mins), Average resolution time (in mins)
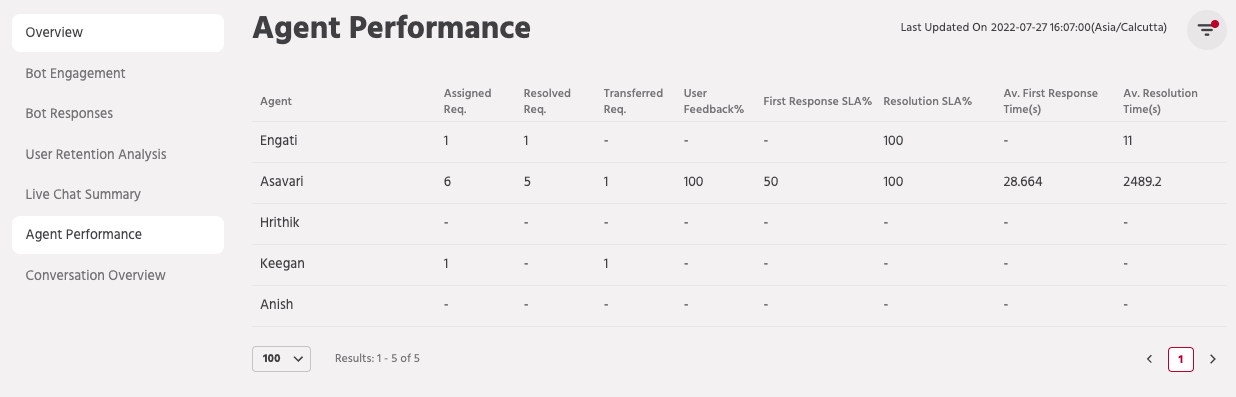
- Inbound Requests: Number of inbound requests (new requests – both new conversations + re-opened conversations handled by both bot and agent) for the chosen time range
- Resolved Requests: Number of inbound requests resolved
- User Feedback: User Feedback is calculated as x% positive
- First Response SLA%: Percentage of inbound requests where first response time is within SLA for first response
- Resolution SLA%: Percentage of inbound requests where resolution time is within the SLA.
- Average first response time (in mins): Average time in minutes for first response for inbound requests
- Average resolution time (in mins): Average time in minutes for resolution for inbound requests
3. Channels view
The Channels Dashboard provides analytics to help you track the metrics around the responses by the active channels.


Metrics
The key metrics for each agent are: Inbound Requests, Resolved Requests, User Feedback%, First Response SLA %, Resolution SLA %, Average first response time (in mins), Average resolution time (in mins)
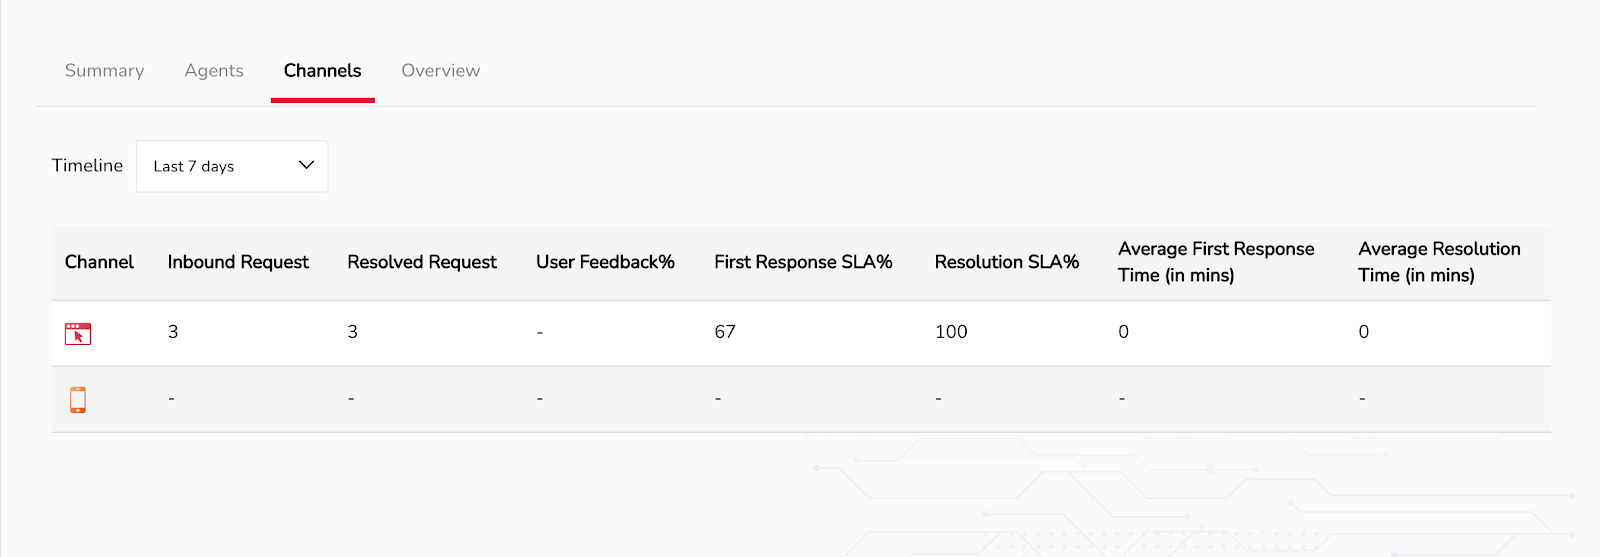
- Inbound Requests: Number of inbound requests (new requests – both new conversations + re-opened conversations handled by both bot and agent) for the chosen time range
- Resolved Requests: Number of inbound requests resolved
- User Feedback: User Feedback is calculated as x% positive
- First Response SLA%: Percentage of inbound requests where first response time is within SLA for first response
- Resolution SLA%: Percentage of inbound requests where resolution time is within the SLA.
- Average first response time (in mins): Average time in minutes for first response for inbound requests
- Average resolution time (in mins): Average time in minutes for resolution for inbound requests
4. Overview
The Overview Dashboard provides analytics to help you track the metrics around the responses by date.
Metrics
The key metrics for each agent are: Inbound Requests, Resolved Requests, User Feedback%, First Response SLA %, Resolution SLA %, Average first response time (in mins), Average resolution time (in mins)
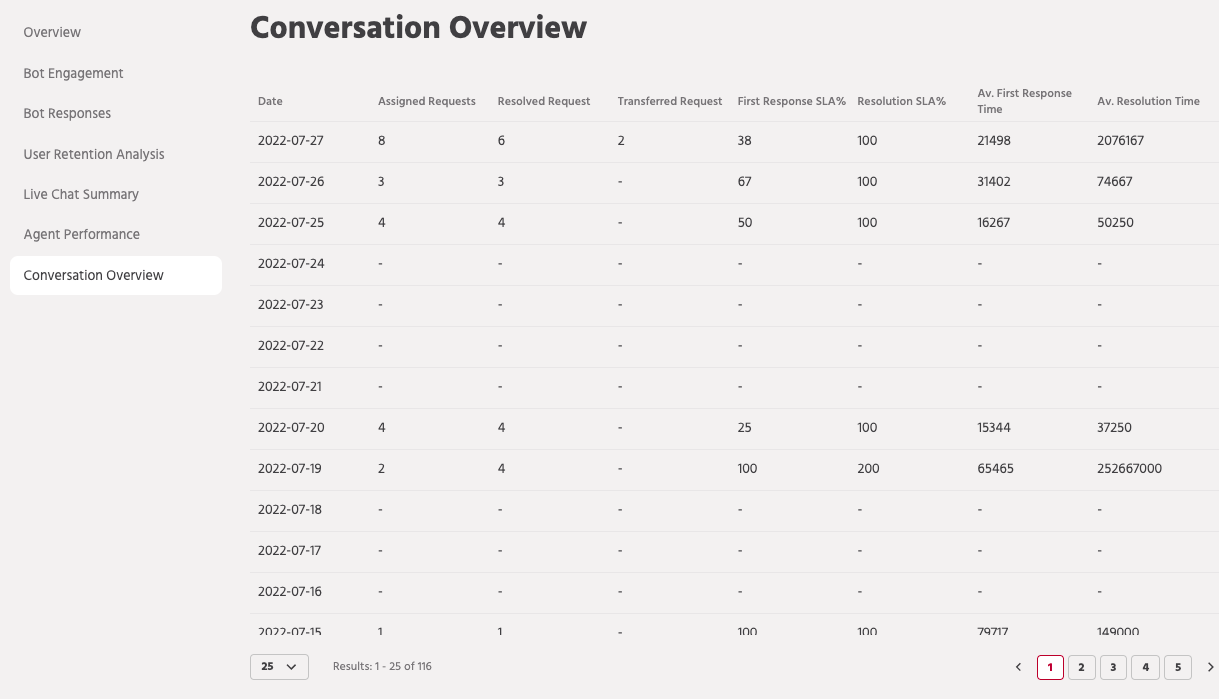
- Inbound Requests: Number of inbound requests (new requests – both new conversations + re-opened conversations handled by both bot and agent) for the chosen time range
- Resolved Requests: Number of inbound requests resolved
- User Feedback: User Feedback is calculated as x% positive
- First Response SLA%: Percentage of inbound requests where first response time is within SLA for first response
- Resolution SLA%: Percentage of inbound requests where resolution time is within the SLA.
- Average first response time (in mins): Average time in minutes for first response for inbound requests
- Average resolution time (in mins): Average time in minutes for resolution for inbound requests


