

What is probability density function?
In probability theory, a probability density function (PDF), or density of a continuous random variable, is a function whose value at any given sample (or point) in the sample space (the set of possible values taken by the random variable) can be interpreted as providing a relative likelihood that the value of the random variable would equal that sample.
In other words, while the absolute likelihood for a continuous random variable to take on any particular value is 0 (since there is an infinite set of possible values to begin with), the value of the PDF at two different samples can be used to infer, in any particular draw of the random variable, how much more likely it is that the random variable would equal one sample compared to the other sample.
Essentially, a probability density function (PDF), in probability theory, serves to define the probability of a random variable coming within a distinct range of values instead of taking on any one value. The probability density function is sometimes also referred to as the probability distribution function or simply a probability function.
What is the formula for probability density function?
To determine the distribution of a discrete random variable we can either provide its PMF or CDF. For continuous random variables, the CDF is well-defined so we can provide the CDF. However, the PMF does not work for continuous random variables, because for a continuous random variable P(X=x)=0 for all x∈ℝ.
Instead, we can usually define the probability density function (PDF). The PDF is the density of probability rather than the probability mass. The concept is very similar to mass density in physics: its unit is probability per unit length. To get a feeling for PDF, consider a continuous random variable X and define the function fX(x) as follows (wherever the limit exists):
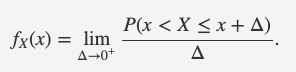
The function fX(x) gives us the probability density at point x. It is the limit of the probability of the interval (x,x+Δ] divided by the length of the interval as the length of the interval goes to 0.
What is probability density function and cumulative distribution function in probability?
Many struggle to differentiate between probability density function (PDF) vs cumulative distribution function (CDF) when working on statistical problem sets. Or wonder why the probability density function does not apply to continuous distributions but is relevant for discrete distributions.
A distribution in statistics or probability is a description of the data. This description can be verbal, pictorial, in the form of an equation, or mathematically using specific parameters appropriate for different types of distributions. Statisticians have observed that frequently used data occur in familiar patterns and so have sort to understand and define them. Frequently seen patterns include the normal distribution, uniform distribution, binomial distribution, etc.
The Cumulative Distribution Function (CDF)
The cumulative distribution function (CDF) is the probability that a random variable, say X, will take a value less than or equal to x.
For example, if you roll a die, the probability of obtaining 1, 2, 3, 4, 5, or 6 is 16.667% (=1/6). The cumulative distribution function (CDF) of 1 is the probability that the next roll will take a value less than or equal to 1 and is equal to 16.667% as there is only one possible way to get a 1. The cumulative distribution function (CDF) of 2 is the probability that the next roll will take a value less than or equal to 2 and is equal to 33.33% as there are two possible ways to get a 2 or below. On the other hand, the cumulative distribution function (CDF) of 6 is 100%. The cumulative distribution function (CDF) of 6 is the probability that the next roll will take a value less than or equal to 6 and is equal to 100% as all possible results will be less than 6.
Probability Density Function (PDF)
The probability density function (PDF) is the probability that a random variable, say X, will take a value exactly equal to x. Note the difference between the cumulative distribution function (CDF) and the probability density function (PDF) – Here the focus is on one specific value. Whereas, for the cumulative distribution function, we are interested in the probability taking on a value equal to or less than the specified value. The probability density function is also referred to as probability mass function. So do not get perturbed if you encounter the probability mass function.
The CDF is the probability that random variable values less than or equal to x whereas the PDF is a probability that a random variable, say X, will take a value exactly equal to x.
What are the properties of probability density function?
Let x be the continuous random variable with density function f(x), the probability distribution function should satisfy the following conditions:
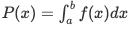
For a continuous random variable that takes some value between certain limits, say a and b, and is calculated by finding the area under its curve and the X-axis, within the lower limit (a) and upper limit (b), then the pdf is given by:
The probability density function is non-negative for all the possible values, i.e. f(x)≥ 0, for all x
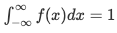
The area between the density curve and horizontal X-axis is equal to 1, i.e.:
Due to the property of continuous random variable, the density function curve is continuous for all over the given range which defines itself over a range of continuous values or the domain of the variable.
What are the applications of the Probability Density Function?
The probability density function has several applications. Here are a few of them:
- In the field of statistics, this function is employed for the purpose of calculating the probabilities associated with the random variables.
- It is also used in modelling the annual data of atmospheric NOx temporal concentration
- This function is also used to model the diesel engine combustion.


