

What is regression analysis?
Regression analysis is a set of statistical processes that estimates the relationship between a dependent variable & one or more independent variable. The most common form of regression analysis is linear regression, in which one finds a straight line or a more complex linear combination that aligns with the given data according to a specific mathematical condition.
What does a regression analysis tell you?
Regression analysis is a reliable method of identifying which variables have impact on a topic of interest. The process of performing a regression allows you to confidently determine which factors matter most, which factors can be ignored, and how these factors influence each other.
In order to understand regression analysis fully, it’s essential to comprehend the following terms:
- Dependent Variable: Often called the "outcome" or "response" variable. This is the main factor that you’re trying to understand or predict.
- Independent Variables: Also known as often called "predictors," "covariates," "explanatory variables," or "features." These are the factors that you hypothesize have an impact on your dependent variable.
How does regression analysis work?
In order to conduct a regression analysis, you have to define a dependent variable that you think is being influenced by one or several independent variables.
Then, establish a comprehensive dataset to work with. For example, handing out surveys to your audiences of interest is a terrific way to establish this dataset. Your survey should include questions addressing all of the independent variables that you are interested in.
Once you've collected enough data, you can begin investigating whether or not there is a relationship between these two variables. Start by plotting these data points on a chart.
The dependent variable should be plotted on the y-axis, while the independent variable should be plotted on the x-axis.
Once plotted, you may see some correlations. Draw a line through the middle of all of the data points on the chart. This line is referred to as your regression line, and it can be precisely calculated using a standard statistics program like Excel.
The regression line represents the relationship between your independent variable and your dependent variable.
There are several mathematical softwares that provide a formula for the slope of the line, which adds further context to the relationship between your independent and dependent variables.
The formula for a regression line might look something like y = 100 + 7x + error term.
This tells you that if there is no x, then y = 100. If, for example, x is the increase in supply, this informs us that if there is no increase in supply, demand will still increase by 100 points.
You’ll notice that the slope formula calculated sometimes includes an error term. Regression lines always consider an error term because in reality, independent variables can never perfectly predict how the dependent variables behave. This makes sense while looking at the impact of supply on demand — there are clearly other variables that are contributing to demand outside of supply, like current trends, seasons, etc.
Your regression line is simply an estimate based on the data available to you. So, the larger your error term, the less accurate your line of regression.
What is regression analysis for?
As we've mentioned, regression analysis is a helpful statistical model to describe relationships between sets of variables. It can be used across organizations to identify trends, and actionable business insights.
Regression analysis produces a regression equation where the coefficients represent the relationship between each independent variable and the dependent variable. You can also use the equation to make predictions. The possibilities are endless.
The next time someone in your business is proposing a hypothesis that states that one factor, whether you can control that factor or not, is impacting a portion of the business, suggest performing a regression analysis to determine just how confident you should be in that hypothesis! This will allow you to make more informed business decisions, allocate resources more efficiently, and ultimately boost your bottom line.
Regression analysis can handle many things. For example, you can use regression analysis to do the following:
- Model multiple independent variables
- Include continuous and categorical variables
- Use polynomial terms to model curvature
- Assess interaction terms to determine whether the effect of one independent variable depends on the value of another variable
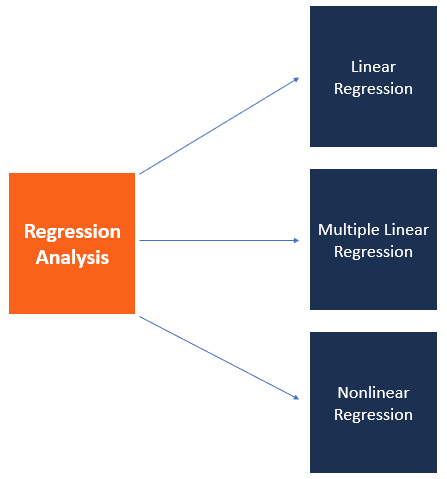
Which regression model is best?
There are numerous types of regression models that you can use. This choice often depends on the kind of data you have for the dependent variable and the type of model that provides the best fit.
1. Linear regression
Linear regression, also known as ordinary least squares (OLS) and linear least squares, is the real workhorse of the regression world. Use linear regression to understand the mean change in a dependent variable given a one-unit change in each independent variable. You can also use polynomials to model curvature and include interaction effects. Despite the term “linear model,” this type can model curvature.
Linear models are the oldest type of regression. It was designed so that statisticians can do the calculations by hand. However, OLS has several weaknesses, including a sensitivity to both outliers and multicollinearity, and it is prone to overfitting.
To address these problems, statisticians have developed several advanced variants:
- Ridge regression: Ridge regression allows you to analyze data even when severe multicollinearity is present and helps prevent overfitting. This type of model reduces the large, problematic variance that multicollinearity causes by introducing a slight bias in the estimates. The procedure trades away much of the variance in exchange for a little bias, which produces more useful coefficient estimates when multicollinearity is present.
- Lasso regression (least absolute shrinkage and selection operator): Lasso regression performs variable selection that aims to increase prediction accuracy by identifying a simpler model. It is similar to Ridge regression but with variable selection.
- Partial least squares (PLS) regression: PLS Regression is useful when you have very few observations compared to the number of independent variables or when your independent variables are highly correlated. PLS decreases the independent variables down to a smaller number of uncorrelated components, similar to Principal Components Analysis.
2. Non-linear regression
Nonlinear regression also requires a continuous dependent variable, but it provides a greater flexibility to fit curves than linear regression.
Like OLS, nonlinear regression estimates the parameters by minimizing the SSE. However, nonlinear models use an iterative algorithm rather than the linear approach of solving them directly with matrix equations. What this means for you is that you need to worry about which algorithm to use, specifying good starting values, and the possibility of either not converging on a solution or converging on a local minimum rather than a global minimum SSE. And, that’s in addition to specifying the correct functional form!
Most nonlinear models have one continuous independent variable, but it is possible to have more than one. When you have one independent variable, you can graph the results using a fitted line plot.


